

A client site goes slow, then starts throwing errors, then someone asks the worst question in the room. Was it a real attack, or was this the approved pen test nobody warned the help desk about?
That happens more than most MSPs want to admit. Raw IIS logs usually exist, but they’re messy, noisy, and spread across multiple web servers. If your team can’t read them fast, you lose time during incident response, confuse a sanctioned penetration test with a live threat, and make compliance conversations harder than they need to be.
Good iis logs analysis fixes that. It helps an MSP, vCISO, GRC advisor, or reseller answer three practical questions fast. What happened, is it still happening, and does the evidence support a clean client update for SOC 2, HIPAA, PCI DSS, or ISO 27001 work.
Why IIS Log Analysis Is Crucial for MSPs

A client’s web app starts throwing 404s, then a few 500s, then the help desk wants to know whether they should wake up the client’s leadership team. IIS logs are usually the fastest way to answer that with evidence instead of opinions.
For MSPs, that answer has direct business value. The same log review that confirms a real intrusion can also show a recent or active penetration test. Repeated requests for known test paths, bursts of odd verbs, staged enumeration from a small set of IPs, and clean progression from recon to exploit checks often look different from commodity attack traffic. If your team can spot that pattern early, you avoid wasting client goodwill on a false alarm and you look like the security partner in the room, not the server team reading raw text files.
Manual review is the weak point. IIS logs are plain text, high volume, and noisy. A Loggly overview of analyzing IIS logs makes the practical point well: even a short sample can hide the sequence you specifically need, especially when you are trying to reconstruct what happened across requests, sites, and timestamps.
Why this changes the MSP role
Strong IIS log analysis gives MSPs a faster path to three outcomes clients will pay for. Better incident triage. Better evidence for compliance and board-level reporting. Better context for selling follow-on security work.
That matters in regulated environments, but it also matters in ordinary client conversations. If a customer asks whether suspicious web traffic was an attack, a scanner, or their approved tester validating controls, you need more than a screenshot from the firewall. You need request paths, methods, status codes, user agents, referrers, and timing lined up well enough to explain what happened in plain English.
This also ties directly into broader network security assessment work for client environments. IIS logs show how internet-facing applications are being touched in actual operation, which helps you scope reviews faster and recommend the right next step without padding the engagement.
Where MSPs get value fast
The immediate win is speed. Good log analysis helps your team answer whether the activity was opportunistic noise, targeted abuse, or a sanctioned test that followed a recognizable pattern.
It also strengthens common client engagements:
- For SOC 2 work: IIS logs support audit trails, retention discussions, and incident evidence around public-facing systems.
- For HIPAA environments: They help document suspicious access attempts and show whether web-facing patient or staff portals were probed.
- For PCI DSS and ISO 27001 engagements: They support control validation, event investigation, and follow-up after suspicious web activity.
Practical rule: If the client runs an internet-facing Microsoft web application, IIS logs should be part of the security review.
What works in practice
A quick spot check can help during the first few minutes of triage. It does not scale across multiple client tenants, several IIS sites, and more than one web server.
What does scale is consistent parsing and correlation. Teams get useful answers when they line up status codes, request paths, source IPs, user agents, and time windows across all affected hosts. That is how you catch the difference between random spray-and-pray traffic and a tester methodically checking authentication bypasses, admin panels, file upload paths, or old vulnerabilities the client asked to validate.
For an MSP, that creates a service edge that clients notice. You can respond faster, explain findings clearly, and keep the engagement affordable because your team is working from evidence instead of guessing.
Collecting and Preparing Logs for Analysis
The best analysis starts with boring discipline. If collection is sloppy, everything after that is slower, weaker, and easier to misread.
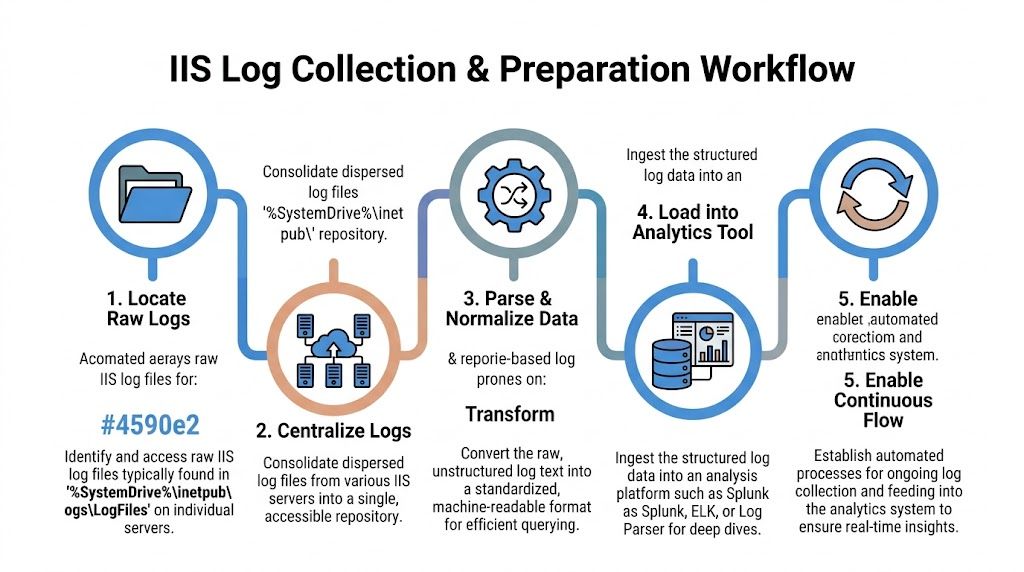
Start with the right files
IIS logs are commonly found under %SystemDrive%\inetpub\logs\LogFiles. In practice, you also need to know which site ID maps to which client application, because IIS writes separate log sets per website.
Focus on W3C format whenever possible. It’s the most detailed of the three primary IIS log formats. W3C uses spaces, NCSA uses spaces with less customization, and IIS format uses commas with moderate information density. That structure difference matters when you’re building searches, normalizing fields, and trying to compare one client’s environment to another.
Centralization is not optional
Reviewing one server at a time feels manageable until you miss the pattern spread across several hosts. Distributed environments create much larger datasets, and the useful signal usually appears only after you bring everything together.
A simple collection workflow looks like this:
- Identify all IIS hosts that serve the app, admin portal, API, or client-facing site.
- Pull logs to a separate analysis location so you don’t create resource contention on the production IIS server.
- Normalize the same fields across all sources, especially method, URI, status, user agent, referer, and response time.
- Load them into a tool that can search at speed, such as Log Parser, SQL-backed workflows, Splunk, or ELK.
- Keep the flow continuous so your team isn’t doing incident response with stale evidence.
Moving large IIS W3C logs off the web server before deeper analysis is a practical safety habit. It protects production performance and makes heavier queries easier to run.
What to capture first
For security work, don’t overcomplicate the first pass. Capture the fields that answer who, what, when, and how long. In real reviews, these usually do the most work:
- Request path: Helps you see targeted pages, admin panels, and unusual probes.
- Status code: Shows auth failures, application errors, and scanning behavior.
- User agent: Useful for separating browser traffic from scanners and scripted tools.
- Response time: Critical for spotting fragile endpoints and abuse patterns.
- Client source details: Needed for clustering requests into likely sessions or test activity.
Many MSP teams already understand network telemetry better than web telemetry. That’s why it helps to connect IIS review with a broader network security assessment approach so web logs don’t live in a silo.
The trade-off most teams miss
More logging gives you more visibility, but it also gives you more noise. Since IIS logs are ASCII text and often large, manual parsing slows teams down and can delay incident detection. That’s one reason automated analysis platforms matter so much for affordable service delivery. They let smaller MSP teams move faster without staffing like a giant consulting firm.
Essential Queries for Detecting Common Attacks
Once the logs are centralized, the job changes from collection to pattern recognition. You’re not reading line by line. You’re asking focused questions and pulling back the smallest useful set of evidence.

Query for brute-force and auth abuse
A strong first query is failed login concentration. Huntress notes that security teams often watch for more than 20 failed logins in 5 minutes to trigger automated alerts in IIS-related investigations.
Use your platform to group by source, time window, and status. In plain terms, you want:
- repeated 401 responses
- concentrated in a short period
- tied to one source or a small cluster of sources
- often targeting login, admin, or API auth paths
If the result is broad, random, and noisy, it may be generic internet background traffic. If it’s focused on one app and one auth path, it deserves immediate review.
Query for SQL injection attempts
For SQLi detection, search the request path and query string for payload markers your team already knows from pentest work. Terms like UNION, SELECT, encoded quotes, comment markers, and odd parameter combinations are common starting points.
Keep the output grouped by URI and source pattern. Then compare it to app behavior. A weird-looking parameter in a search function may be normal. The same pattern on a login form or admin endpoint is not.
If your team wants a deeper technical checklist, this guide on how to test for SQL injection helps frame what those payloads usually look like during a pen test or live exploitation attempt.
Query for path traversal and file probing
Path traversal and LFI-style requests often stand out in IIS logs because the requested URI looks wrong for the application. Search for traversal patterns, requests into sensitive directories, repeated 404s against framework paths, and odd method usage against pages that should only receive standard browser requests.
A practical review table helps here:
Pattern to reviewWhy it mattersRepeated 404s on unusual pathsOften indicates scanner activity or manual reconOPTIONS requests to many endpointsCommon during probing, tool-based enumeration, or a controlled penetration testRequests with traversal syntaxSuggests path traversal or file inclusion testingSpikes in 500-series errorsMay indicate exploit attempts, app instability, or poor input handling
Don’t treat every ugly URL as compromise. Treat it as intent. Then validate whether the app accepted it, rejected it, or failed while processing it.
Query for performance abuse and weak pages
Performance analysis belongs in security review because fragile pages often become attack paths. Microsoft’s IIS troubleshooting guidance includes a SAT-style scoring method based on response time: under 2s is treated as successful, 2-8s as sluggish, over 8s as slow, and HTTP 400+ responses count as failures in the scoring logic described in this IIS performance analysis method.
That approach matters during penetration testing because URLs with weak satisfaction scores often expose expensive queries, brittle middleware, or poor input handling. Those are the same places where time-based attacks, heavy enumeration, and auth bypass testing get traction.
A practical query should group by URL and report:
- Total requests
- Failed requests
- Sluggish requests
- Slow requests
- SAT score by URL
A score below the 90-95% target range is worth attention in that Microsoft guidance, especially when the affected path is sensitive or internet-facing.
Why logs matter beyond the web server
Web activity doesn’t live alone. If you’re already tracking suspicious browser sessions, fake updates, or endpoint account abuse, it helps to understand adjacent threats too. This write-up on the rising threat of infostealer malware is useful context because compromised credentials often show up later as strange web login activity in IIS.
Distinguishing Pentests from Real World Attacks
This specific challenge often impedes MSP teams. A sanctioned pen test can look hostile in the logs, especially if the client contact forgot to tell the service desk, the SOC, or the compliance lead.

The answer isn’t guessing. The answer is pattern quality, scope discipline, and correlation.
What a pentest usually looks like
Professional testers tend to be methodical. Their requests often cluster around defined windows, known targets, and repeatable workflows. You may see concentrated recon, parameter testing, login checks, and endpoint discovery done in a way that maps to a testing plan.
Common indicators include:
- Consistent targeting: The activity follows the in-scope app rather than wandering everywhere.
- Tool fingerprints: You may see recognizable scanner or browser automation behavior in the user agent field.
- Controlled progression: Recon comes first, then validation, then focused exploitation attempts if allowed.
- Known source pattern: The traffic often comes from a small set of expected locations approved before the engagement.
That doesn’t mean a professional penetration test is quiet. It means it’s usually more disciplined than criminal spray-and-pray traffic.
What a real attack often looks like
A live attacker may still be careful, but many real-world intrusions are messy at first. They probe many paths, switch tactics fast, and generate broad errors while looking for something easy.
One of the strongest signals is correlation with surrounding systems. Advanced IIS review benefits from pairing web logs with firewall and network data. A Sumo Logic discussion of IIS log metrics notes that a spike in 401, 403, or 500 errors greater than 5% above baseline can indicate brute-force or bypass attempts, and that User-Agent anomalies account for 25% of detected fraud.
If the web logs look suspicious but the firewall, endpoint, and authentication records stay quiet, you may be looking at scanner noise or an approved test rather than an active breach.
The user-agent field matters more than teams think
Many teams glance at user agents. Good analysts use them.
Compare three situations:
PatternMore likely explanationOdd user agent tied to broad endpoint probingAutomated scanner or opportunistic attackerSmall set of unusual agents, tightly scoped to in-scope pathsControlled pen testing activityNormal browser strings with abnormal auth and navigation behaviorStolen session, manual attacker activity, or abuse through a real browser
The same source notes that user-agent anomalies are a meaningful fraud signal. For SOC 2-minded MSPs and vCISO teams, that means user-agent review should be a standard part of web log triage, not an afterthought.
Use context, not assumptions
A sanctioned pentest, penetration test, or penetration testing engagement should have paperwork, scope, timing, contacts, and approved source details. If those exist, your job gets easier. If they don’t, the logs still help you decide whether to escalate.
Ask these questions in order:
- Was a test scheduled? Check change records, ticket notes, and client approvals.
- Do the requests align with the scope? A web app test should stay near the tested app and supporting auth flows.
- Is the pattern systematic or chaotic? Methodical probing fits a mature tester more than a random bot.
- Do other systems support the story? Firewall, Windows events, and EDR records should match the timeline.
This matters for GRC, PCI DSS, and ISO 27001 support because false positives waste time and false negatives create audit and incident problems. Good log interpretation helps you tell the client the truth faster, with fewer guesses and fewer embarrassing internal escalations.
Automate Alerts and Partner for Expert Pentesting
A client calls because their IIS logs suddenly show bursts of 401s, odd paths, and a sweep across admin endpoints. Your team needs to answer two questions fast. Is this an actual intrusion attempt, or did someone approve a pen test and forget to tell operations?
That decision gets easier when alerts are tuned for patterns that matter to MSPs. Build them around behavior that suggests active testing, recent validation work, or a live attack that needs containment. Pair IIS logs with Windows events, firewall data, and ticketing context so your analysts can check scope, timing, and source activity in one pass.
What to automate first
Start with detections your team can triage quickly and explain clearly to clients:
- Failed login bursts from a single source or small IP set: Often the first sign of password spraying, auth brute force, or a tester validating weak controls.
- Short runs of 404s and 500s across uncommon paths: Common during recon, forced browsing, and scanner-driven content discovery.
- Suspicious methods, encoded URLs, and traversal patterns: Useful for spotting web shell checks, exploit validation, and noisy probing against legacy apps.
- Tight request sequencing against login, upload, and admin functions: A good signal for manual testing activity, especially when the sequence is methodical instead of random.
- Response-time spikes on specific endpoints: Helpful for catching resource exhaustion attempts and poorly defended pages before they become an outage ticket.
If your team is still maturing alerting and correlation, this overview of Security Incident and Event Management (SIEM) systems is a useful reference for deciding how collection, triage, and escalation should work.
Automation helps with speed, but its primary value is classification. An alert that says "suspicious IIS activity" is not enough for an MSP. You need enough context to tell a client whether the pattern looks like sanctioned testing, commodity scanning, or hands-on attacker behavior.
That is where a channel-friendly testing partner helps. If your clients want proof beyond log review, use a dedicated pentest partner program for MSPs and vCISOs that can validate exposure quickly, stay in your lane, and support white-label delivery. It is often the fastest way to add manual pentesting to your service stack without hiring a full offensive team.
If you want a channel-only team for affordable, fast, manual pentesting with OSCP, CEH, and CREST-certified testers, MSP Pentesting can help you deliver white-labeled pen test, penetration test, and penetration testing services without competing for your clients. Contact us today to learn more.

.png)
.png)

